How Much More Do Brokers Earn With a Direct Funder vs Chain?
Most ISO brokers have a rough sense of what they earn per deal. The commission hits their account, they move on, and the cycle repeats. What they rarely calculate is how much got pulled out before that number appeared, and understanding those direct funder vs broker chain commission differences is often the fastest way to increase take-home pay without closing a single additional deal.
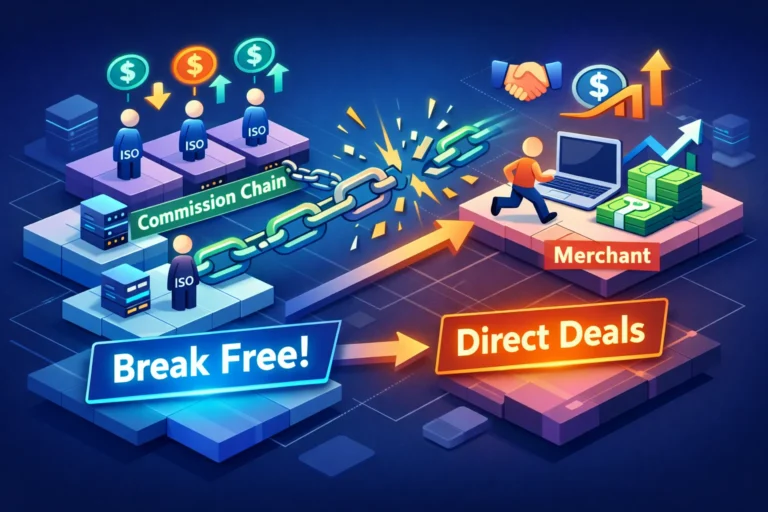
Broker chains, commonly called daisy chains in the working capital space, are one of the most quietly expensive habits a broker can operate inside. Every tier in the chain extracts a cut from your commission. In commercial working capital lending, there are no standardized disclosure requirements equivalent to residential mortgage rules, so nobody at any level is obligated to show you the full picture. The broker doing the actual work, packaging the deal, managing the merchant, running down documents, walks away with a fraction of what a direct submission would have paid.
This article runs the real numbers. You’ll see exactly how commissions move through a chain, what a direct funder relationship actually pays, and the dollar difference between the two across realistic deal sizes. If you want to skip straight to your own numbers, Greenvest offers a free commission calculator that models your earnings on a direct deal before you ever submit one.
How the Money Actually Moves Through a Broker Chain
A daisy chain starts the moment an ISO broker submits a deal not to the funder directly, but to another broker acting as an aggregator or mid-tier connector. That broker forwards it to the funder. For newer brokers without direct funder relationships, this arrangement feels like a reasonable shortcut. In practice, it means splitting your loan broker commission with someone who added no material value to the deal itself. Industry guides on using a loan broker describe this shortcut and its trade-offs.
Here’s how a typical split works as an illustrative example: the aggregator negotiates the commission rate directly with the funder and might earn 12 points on a deal. They pass 8 to you and keep 4. Industry estimates suggest broker markup skims in MCA and working capital chains commonly fall somewhere in the 2, 5 point range, though the exact split varies by relationship and volume. Sometimes the split is disclosed upfront. Often it isn’t. The funder pays the top of the chain, the top of the chain pays you, and you have no visibility into what the total payout was in the first place. The broker doing the actual work has the least information about what the deal was worth. That information asymmetry is not accidental. It’s what makes the chain model profitable for the aggregator.
Beyond the commission skim, chains slow down the entire underwriting process. Your deal travels from you to the aggregator to the funder. Questions bounce back through the same route. In competitive working capital situations, even a one-day delay can cost you the deal entirely. A merchant who needed funding yesterday doesn’t wait politely for your chain to sort itself out.
What Direct Funder Commission Structures Actually Pay
Commission Ranges and What Drives Them
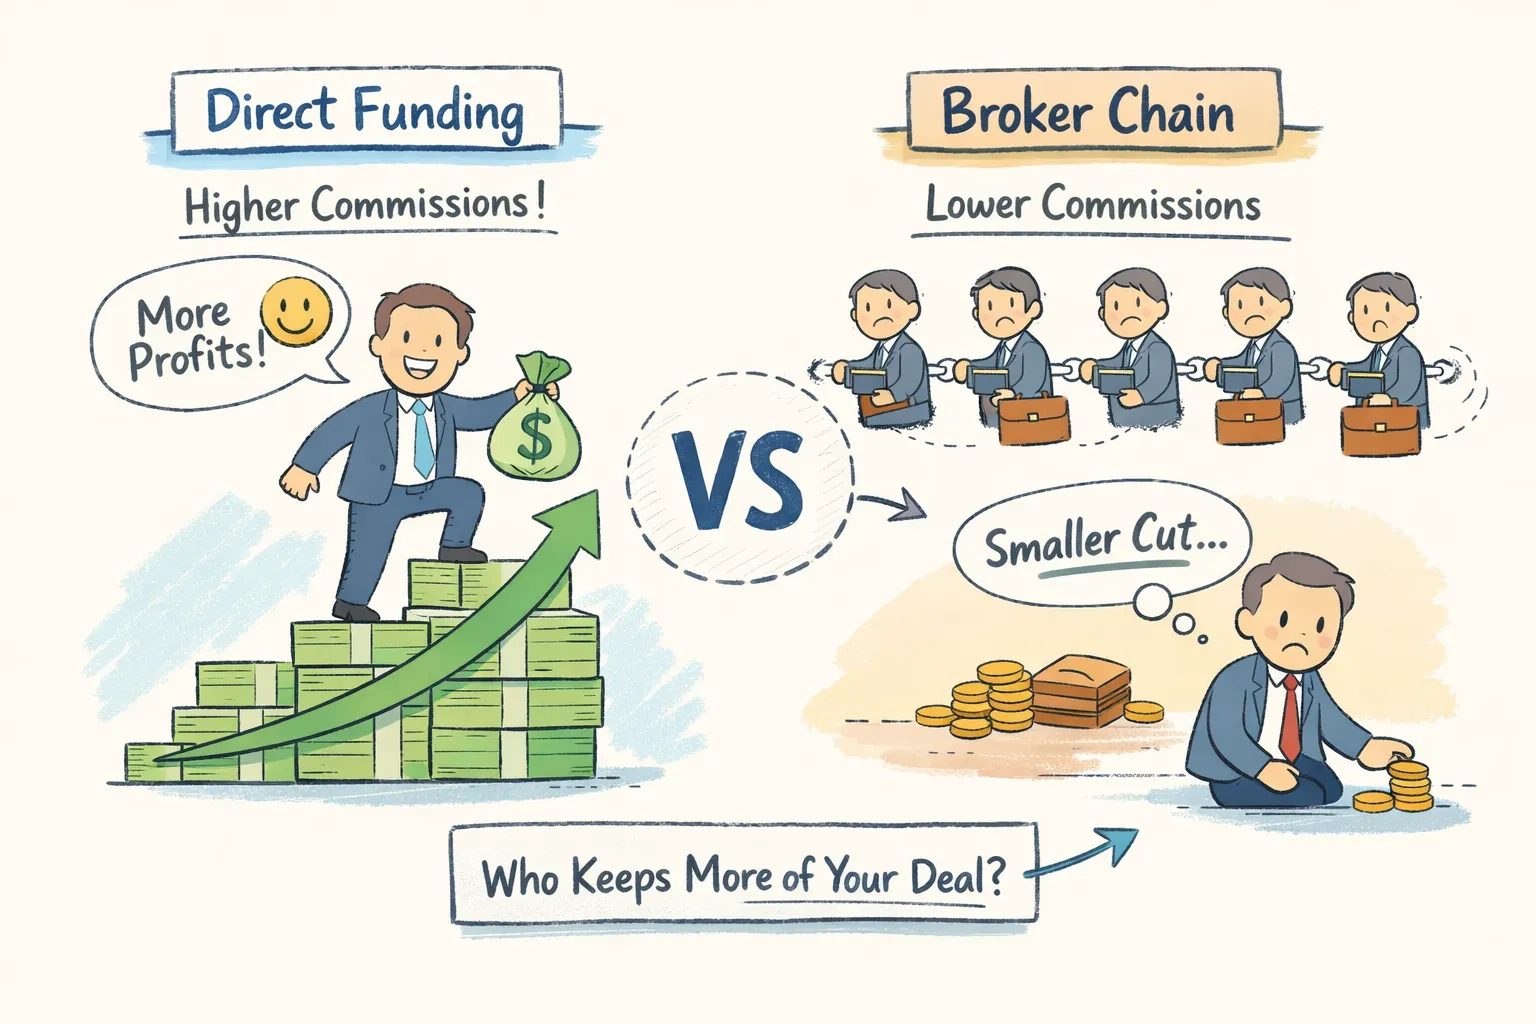
When you submit directly to a funder, the broker commission negotiation happens between you and one party. No intermediary, no split. On working capital deals in the $100K to $1M range, direct funders typically pay ISO commissions between 8% and 15% of the funded amount, with the most commonly cited averages falling in the 8%, 12% range depending on deal size, borrower risk profile, and term structure. The full rate goes to you. You know it before the deal closes, and you receive it at funding.
The transparency piece matters more than most brokers realize. Direct funders who take ISO partnerships seriously share their commission schedules during onboarding, not after the first deal. That upfront commission disclosure changes how you operate. You can price merchant conversations more accurately, set realistic expectations on your pipeline, and calculate what your book of business is genuinely worth at any given point. With a chain, you’re always estimating. With a direct funder, you’re working with real numbers from day one. Comparisons of brokered financing versus direct lending underscore how intermediaries affect take-home pay.
Greenvest shares its full commission structure with broker partners during onboarding and offers a free commission calculator so brokers can model earnings before submitting a single deal, turning income planning from guesswork into a repeatable process.
The Earnings Gap in Real Deal Scenarios
Consider this illustrative comparison. A merchant qualifies for $300,000 in working capital. You package the deal, gather the documents, and submit it through an aggregator. The funder pays the aggregator 11 points, $33,000 on a $300K funded amount. The aggregator passes you 7 points and keeps 4. Your commission: $21,000. The aggregator earned $12,000 for forwarding your deal and holding a pre-existing funder relationship.
Run that same deal as a direct submission to a funder with a transparent 10-point commission schedule. Your commission: $30,000. Same merchant, same deal structure, same funded amount. The only variable is whether a middleman sits between you and the money. On a single deal, that gap is $9,000. Close four deals like this in a month and you’ve left $36,000 on the table simply by staying inside a chain you didn’t need.
Scale that math across a moderate book of business, say, $3M in funded volume per month, and the difference between chain commissions and direct lender commissions can exceed $300,000 annually, depending on the skim percentage and deal mix. That figure assumes no additional deals closed, no new merchants sourced, no extra hours worked. The effort is identical. The relationship structure is the only thing that changes the result. Brokers who haven’t run this calculation on their own deal volume are often surprised by how large the gap actually is.
Why Chains Stay Quiet About What They Keep
Aggregators and mid-tier brokers benefit structurally from brokers not knowing the full commission picture. If you knew the funder was paying 12 points and you were receiving 7, you’d either negotiate that gap or find a direct relationship. The chain model persists specifically because brokers don’t have access to the top-level commission data. Opacity is what makes the arrangement profitable for the aggregator, not the quality of their service or the value they add to your deal.
This dynamic isn’t unique to the working capital space. In residential mortgage lending, regulators including the CFPB have taken enforcement action against undisclosed broker compensation arrangements that steered borrowers toward higher-rate products. The commercial lending space operates with fewer standardized disclosure requirements than residential mortgages, which means the information asymmetry in MCA and working capital chains is largely self-policed. The broker who asks the right questions is the broker who keeps the most money. For additional regulatory context, review HUD guidance on mortgage and housing disclosures.
Before your next deal goes anywhere, ask these questions directly. Who receives the commission from the funder, and at what total rate? What is the documented split between that party and you? Is there a direct funder relationship available that removes the intermediary entirely? The answers will tell you immediately whether you’re operating inside a chain and what that chain is costing you per deal.
What the Math Looks Like on Smaller Deal Sizes
The $300K example is compelling, but the direct funder vs broker chain commission difference holds across all deal sizes. On a $150,000 working capital deal, a chain that skims 3 points costs you $4,500 on that single transaction. On a $500,000 deal, the same 3-point skim is $15,000. These are not edge cases, they are the standard operating cost of working through an aggregator instead of a direct lender. Many deals submitted through chains result in lower ISO take-home pay precisely because the upstream skim is built into the structure before you ever see the number.
The borrower side of this equation is worth noting too. When chains add layers of commission, those costs don’t disappear. They get embedded in the factor rate or the terms the merchant receives. A merchant getting funded through a two-layer chain may pay meaningfully more over the life of the advance than a merchant working with a broker who submits directly. On a $100,000 deal, rate markups introduced by chain layers can translate into a material cost difference for the merchant, enough to affect whether they renew with you or shop elsewhere. Your long-term business depends on merchants who trust that your deals are competitive.
How to Close the Gap and Keep What You Earn
The straightforward answer is to build direct funder relationships that remove the intermediary entirely. In theory it’s simple, but it requires three things: funders willing to work directly with ISO partners, transparent underwriting criteria you can actually use, and infrastructure to manage a direct pipeline without drowning in manual work. For further reading on typical broker earnings and what to expect from direct relationships, see this guide on how much business loan brokers make.
Greenvest’s ISO broker partner program is built to address each of those friction points. Direct working capital funding from $100K to $5M, fast underwriting decisions, full commission transparency upfront, and a free GoHighLevel CRM sub-account so you can manage your pipeline without adding software costs to your overhead. The Funded Founder private community gives broker partners weekly live Q&A, deal packaging guidance, and market intelligence to structure deals that close. That combination is specifically designed for brokers who want a direct funder relationship with real support, something most aggregator arrangements aren’t set up to provide.
The commission calculator is the fastest starting point for understanding your own direct funder vs broker chain commission differences. Input your current deal volume and average funded amount, and you’ll see what direct commissions would have paid on deals you’ve already closed. For most brokers who’ve been operating in chains, that number clarifies things quickly. The gap between what you’ve earned and what you could have earned tends to be larger than expected, and it compounds with every deal you continue to route through an intermediary. Start with the math, and the right relationship structure becomes obvious.